NSX 6.4 Custom Dashboard Widget - Part 2
In my previous article about NSX 6.4 Custom Dashboard Widget I focused on defining and registering a Label Value type dashboard widget. In this post I’ll go through how you can create a widget with drilldown. In other words, you’ll be able to click on the values of your widget and see additional data. We can achieve this with combination of LabelValue and Grid type of widgets.Below is example of what the end result will be after you follow this article:
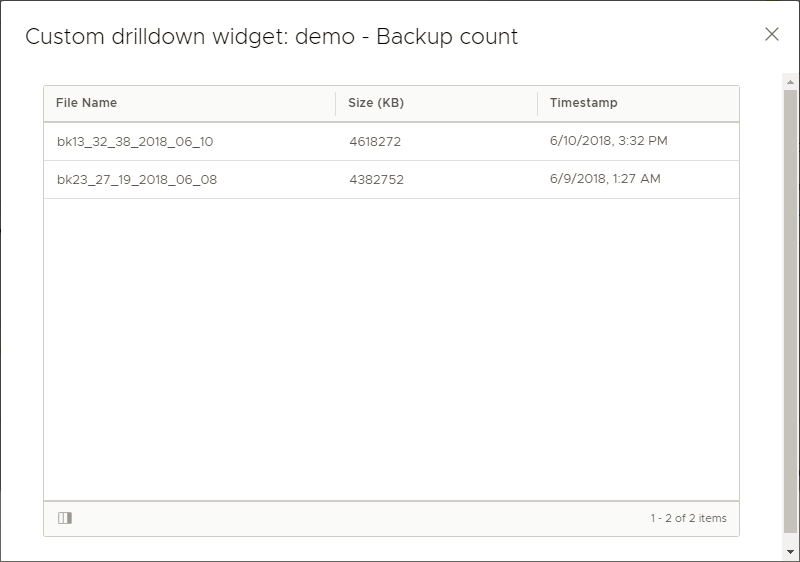
This widget will show the amount of NSX Manager backups. When you click on it, you will see a list including all backup instances - filename, size and creation date.
Step 1: Define the Label Value widget
Unfortunately, we cannot extend the current “Backup status” system widget to include this data so we will have to define our own. I covered how you can create your custom LabelValue widget in previous post. In order to enable drilldowns for it, you need to set the sub_type property to aggregate_count.
This is outlined in the NSX 6.4 API Guide:
“Notes for Drilldowns: Only GridConfiguration is supported as drilldown widget. To make a widget as a drilldown, its category_id should be set as drilldown. Drilldowns are supported for aggregate_count (subtype of LabelValueConfiguration) widgets only. In other words, only 'aggregate_count' widgets can have drilldowns.”
Now we can use the drilldownId in the properties as a link that will give us additional details. Here is an example LabelValue widget configuration that is ready to work with drilldowns:
With this we are prepared with a basic definition of our LableValue widget. Let’s move on and then we will come back for one finishing touch.
Step 2: Define the Grid type widget
The majority of the fields are similar to the Label Value widget. The main difference is that instead of “properties” we have a “columns” section. It defines the table structure and what is going to be included in each column.
To get the expected results, you need an array of objects to show in the grid. In our case such an array is returned by the api/1.0/appliance-management/backuprestore/backups endpoint. Here is an example of the response in JSON format:
We are going to use this endpoint as datasource for our Grid widget.
In the columns section, we will show three values: fileName, fileSize and creationTime. The corresponding types will be String, Number and Date. Note that the Date type will automatically convert the Timestamp from epoch time to human readable format.
Last but not least (as I ran into an error because of it) you need to set the rowListField property. Otherwise, when you try to register your widget with NSX Manager you will get the following error message:
This property is not listed as required for GridConfiguration widget type, and moreover it’s not mentioned at all what exactly it does anywhere in the official NSX for vSphere API Guide. I managed to find the following description in the NSX-T API Guide:
“List of fields from which rows are formed. Rows of grid or table are formed from the list of objects returned by a row list field.”
In our case that would basically be the result of the endpoint we have in datasources, meaning that we will have one row for each performed backup.
We have now covered the major requirements for Grid widget configuration. Here is our example in XML:
Step 3: Register the widgets
Earlier I mentioned that we will need to come back to our LableValue widget. The reason is that we need to link the property to its corresponding Grid widget. In our case, we are going to link the “Backup count” property of our LableValue widget with our Grid widget. When you click on the number displayed for “Backup count” the Grid widget will open and show all backups with their details.
To get things right, first we need to register the Grid widget. Issue a POST request to https:///api/2.0/services/dashboard/ui-views/dashboard/widgetconfigurations endpoint. If your widget configuration is valid, you will received the 201 Created status code and the widget configuration in the response body. There you can find the objectId. Place it as the value for the drilldownId property of the LabelValue widget. For example:
Now we can register the LabelValue widget and check the result in the Dashboard:
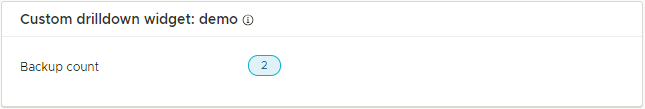
We now have visibility of the backup history of NSX Manager directly from the Dashboard in vSphere Web Client!
It’s worth mentioning that with the aggregate_count sub type of the LabelValue widget, if the result of the API endpoint used as value in the property is empty, you will see No errors or warnings message. This was a simple example that aimed to provide you with a head start for customizing your NSX Dashboard.
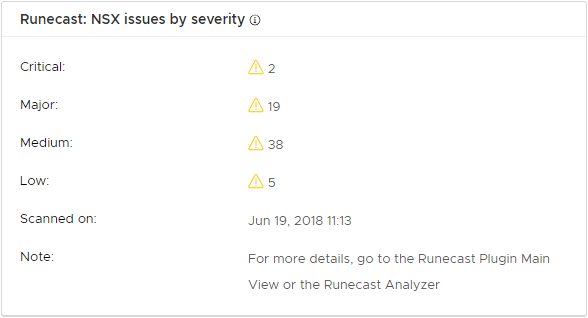
Runecast Analyzer’s support for NSX is just around the corner. You can sign up for a free BETA and try it out. If you connect Runecast Analyzer with NSX Manager using an account with sufficient privileges, you will see a Runecast widget on your NSX Dashboard showing you issues found in your NSX environment.
In the NSX 6.4 release, VMware now allows you to customize your own dashboard widgets. Being able to display your choice of data and custom views is a great addition and opens the door to a world of possibilities. The best part is that these widgets use the powerful NSX API, which allows you to collect and report on a wide variety of metrics. I think that the potential here for customization is immense and I really look forward to seeing what the community and other third parties can come up with.
Mike Da Costa, vswitchzero.com
The ability to customize the NSX Dashboard can increase your general productivity as you can reduce the number of clicks needed to get the data that is important to you. Get the most out of it!
Ivaylo Ivanov
VMware Engineer
Click to view larger image ↑
Click to view larger image ↑
Click to view larger image ↑
Click to view larger image ↑
Click to view larger image ↑