How To Deal With PSOD - The Purple Screen of Death

This article is available in the following languages:


What is PSOD?
PSOD stands for Purple Screen of Diagnostics, often referred to as Purple Screen of Death: from the more known Blue Screen of Death encountered on Microsoft Windows.
It’s a diagnostic screen displayed by VMware ESXi when the kernel detects a fatal error in which it either is unable to safely recover from, or cannot continue to run without having a much higher risk of a major data loss.
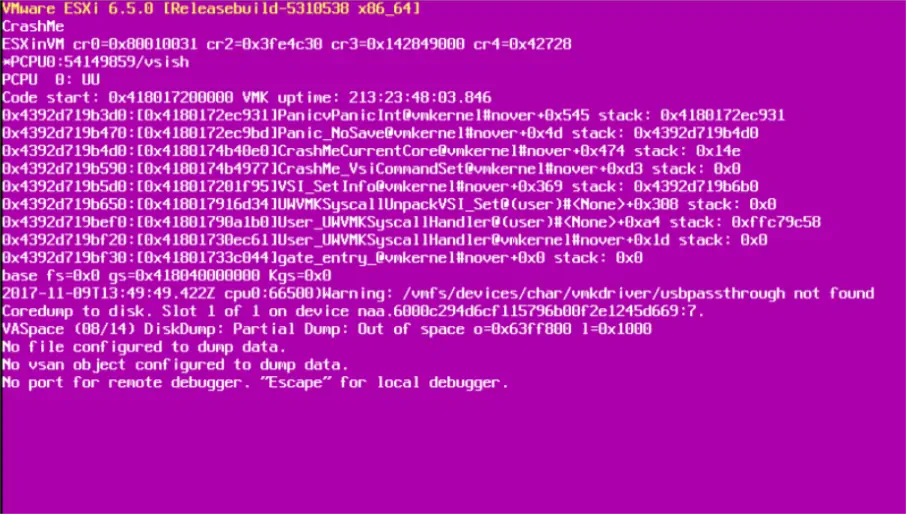
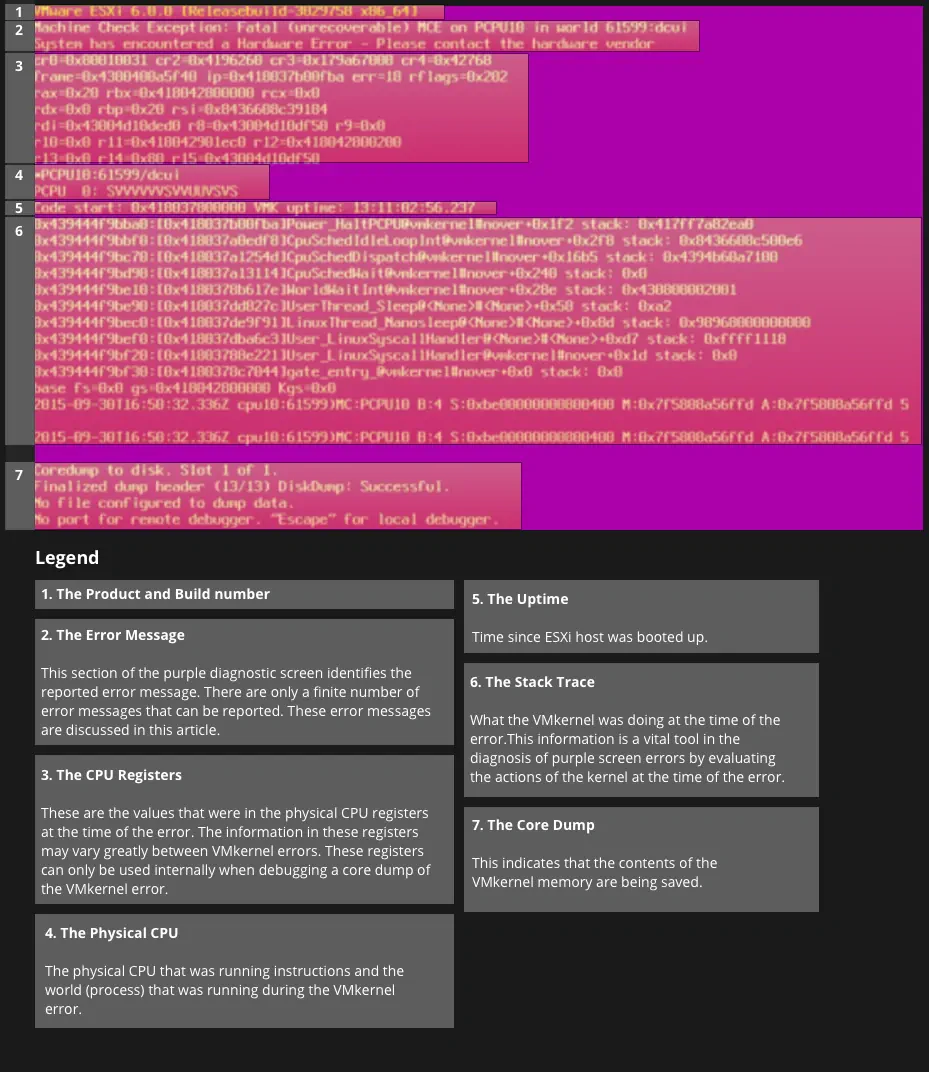
It shows the memory state at the time of the crash and also additional details which are important in troubleshooting the cause of the crash: ESXi version and build, exception type, register dump, backtrace, server uptime, error messages and information about the core dump (a file generated after the the error, containing further diagnostic information).
This screen is visible on the console of the server. In order to see it, you will need to either be in the datacenter and connect a monitor or remotely using the server’s out-of-band management (iLO, iDRAC, IMM… depending on your vendor).
Why does PSOD happen?
The PSOD is a kernel panic. Even though we all know that ESXi is not based on UNIX, the panic implementation fits the UNIX definition. The ESXi kernel (vmkernel) triggers this safety measure in response to an event/error which is unrecoverable and would mean that continuing to run would pose a high risk for the services and VMs. To put it simply: when the ESXi hosts feels it became corrupted, it commits “seppuku” and, while bleeding its purple blood, writes a suicide letter detailing why it did it!
The most common causes for a PSOD are:
1. Hardware failures, mostly RAM or CPU related. They normally throw out a “MCE” or “NMI” error.
- “MCE” - Machine Check Exception, which is a mechanism within the CPU to detect and report hardware issues. There are important details for identifying the root cause of the issue in the codes displayed on the purple screen.
- “NMI” - non-maskable interrupt, which is a hardware interrupt that cannot be ignored by the processor. Since NMI is a very important message about a HW failure, the default response starting with ESXi 5.0 and later is to trigger a PSOD. Earlier versions were just logging the error and continuing. Same as with MCEs, purple screen caused by NMI will provide important codes that are crucial for troubleshooting.
2. Software bugs
- improper interactions between ESXi SW components (ex: KB2105711)
- race conditions (ex: KB2136430)
- out of resources: memory, heap, buffer (ex: KB2034111, KB2150280)
- infinite loop + stack overflow(ex: KB2105522)
- improper or unsupported configuration parameters (ex: KB2012125, KB2127997)
3. Misbehaving drivers; bugs in drivers that try to access some incorrect index or non-existing method (ex: KB2148123)
What’s the impact of PSOD?
When the panic occurs and the host crashes, it terminates all the services running on it together with all the virtual machines hosted. The VMs are not gracefully shutdown, but rather abruptly powered off. If the host is part of a cluster and you’ve configured HA, these VMs will be started on the other hosts in the cluster. Besides the outage and the unavailability of the VMs during the time they are down, some critical applications like database servers, message queues or backup jobs may be affected by the “dirty” shutdown.
Additionally, all other services provided by the host will be terminated, so if your host is a member of a VSAN cluster, a PSOD will impact vSAN as well.
For me, the most troublesome aspect of a PSOD is that it makes you lose trust in your infrastructure and the anxiety it creates, at least until you get to the bottom of it. Ok, you can recover by rebooting and may have HA or even FT so the impact may not be devastating… but until you don’t solve the root cause, the thought that this can happen again or on an another server can keep you up at night.
What to do when PSOD happens?
1. Analyze the purple screen message
One of the most important things to do when you have a PSOD is to take a screenshot. If you are connecting remotely(IMM, iLO, iDRAC,...) to the console it will be easy taking a screenshot, but if you have to go to the datacenter, you may need to literally take out your phone and snap a picture of the screen. There’s a lot of useful information about the cause of the crash in that screen.
2. Contact VMware support
Before you start further investigation and troubleshooting it is advisable to contact VMware support, if you have a support contract. In parallel with your investigation they will be able to assist you in making the Root Cause Analysis (RCA).
3. Reboot the affected ESXi host
In order to recover the server you will need to reboot it. I would also advise keeping it in maintenance mode until you perform the full RCA, identify the cause and fix it. If you can’t afford keeping it in maintenance mode, at least fine tune your DRS rules so that only un-important VMs will run on it, so that if another PSOD hits the impact will be minimal.
4. Get the core dump
After the server boots up you should collect the coredump. The coredump, also called vmkernel-zdump is a file containing logs with similar, but more detailed information to that seen on the purple diagnostic screen and will be used in further troubleshooting. Even if the cause of the crash might seem obvious from the PSOD message that you analyzed in step 1, it is advisable to confirm it by looking at the logs from the coredump.
Depending on your configuration you may have the core dump in one of these forms:
a. On the scratch partition
b. As a .dump file on one of the host’s datastores
c. As a .dump file on the vCenter - through the netdump service
The coredump becomes especially important if the configuration of the host is to automatically reset after a PSOD, in which case you will not get to see the message on screen.
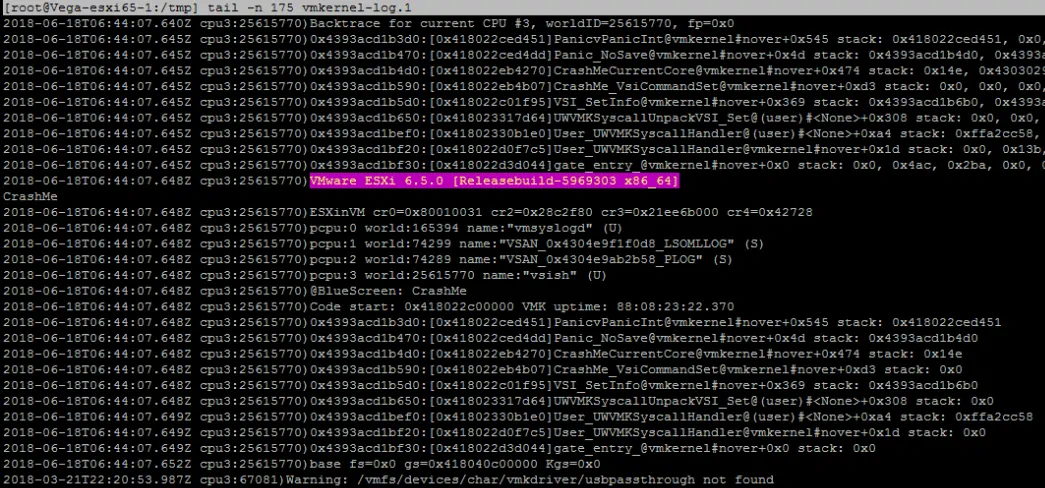
You can copy the dumpfile out of the ESXi host using SCP and then open it using a text editor (like Notepad++). This will contain the contents of the memory at the time of the crash and the first parts of it contain the messages you saw on the purple screen. The whole file may be requested by VMware support, but you can only extract the vmkernel log, which is a bit more … digestible:
5. Decipher the error
Troubleshooting and Root Cause Analysis can make one feel like Sherlock Holmes. PSODs can sometimes turn into a Arthur Conan Doyle inspired story, but in most cases it’s a pretty straightforward process where it will be hard to get to the fifth “why” of the 5 Whys technique.
The most important symptom, and the one you should start with, is the error message generated by the purple screen. Luckily, the number of error messages that can be produced is finite:
Since the kernel panic is handled by the CPU, for more information about these Exceptions see Intel 64 and IA-32 Architectures Software Developer’s Manual, Volume 1: Basic Architecture and Intel 64 and IA-32 Architectures Software Developer’s Manual, Volume 3A.
The most common cases are covered in separate VMware KB articles and I will just maintain a reference table of such errors here since the articles are very detailed and well documented. So use this table as an index for the PSOD errors:
Click to view larger image ↑
Avoid PSOD in your environment
Get full protection and proactive remediation with Runecast
How to prevent PSOD?
Most of the software related PSODs are resolved by patches, so make sure you are up to date with the latest versions.
Make sure that your servers are on VMware’s Hardware Compatibility Checklist, together with all the devices and adapters. This will protect from some of the unexpected hardware related issues, but it will also ensure that VMware support will be able to support you in case of a PSOD.
As described above in “Why it happens”, misbehaving drivers are also an often cause of PSODs, so it’s imperative to regularly check vendors’ support websites for updated firmware and drivers and especially for the documented PSOD causing drivers to respond as soon as possible by upgrading them.
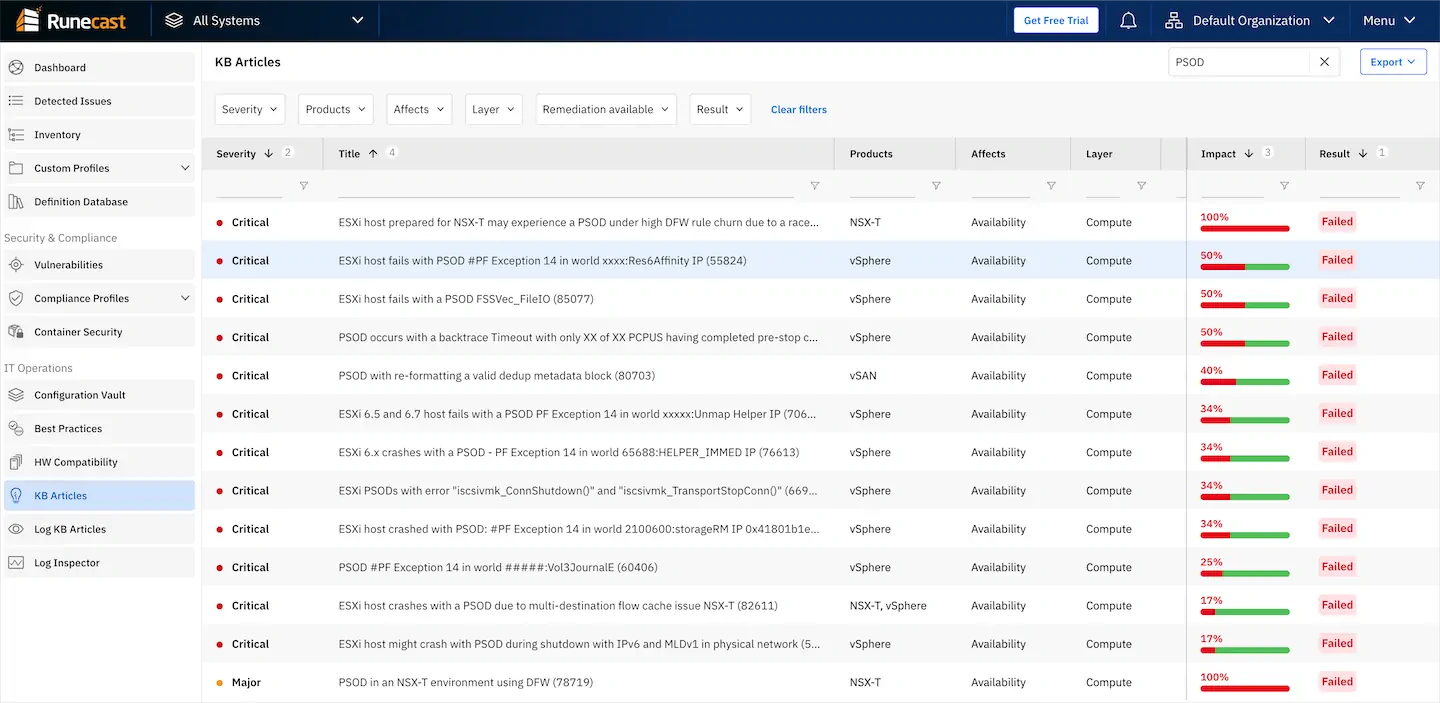
At Runecast, we regularly analyze the entire VMware Knowledge Base (kb.vmware.com) which consists of more than 30,000 articles. We are extracting actionable insights from the KBs in order to proactively make virtualized infrastructures more resilient, secure and efficient. We are very familiar with the PSOD and are able to identify most of the preconditions that can lead to this problem. By proactively analyzing your environment, Runecast Analyzer will help you steer away from these issues, so you can have the peace of mind that most PSODs lurking in your environment are prevented.

Click to view larger image ↑
Click to view larger image ↑
Click to view larger image ↑
Click to view larger image ↑
Meet other Runecasters here:
Take Runecast for a spin
Get full protection and proactive remediation with Runecast